The Data Behind Healthy Hives
A single beehive inspection tells you very little on its own — it is the record of inspections, tracked consistently over time, that reveals colony problems early enough to act on.
Written for beekeepers, apiary managers, and pollinator researchers. Every statistic on this page is attributed inline to its source and listed in the Sources section at the end.
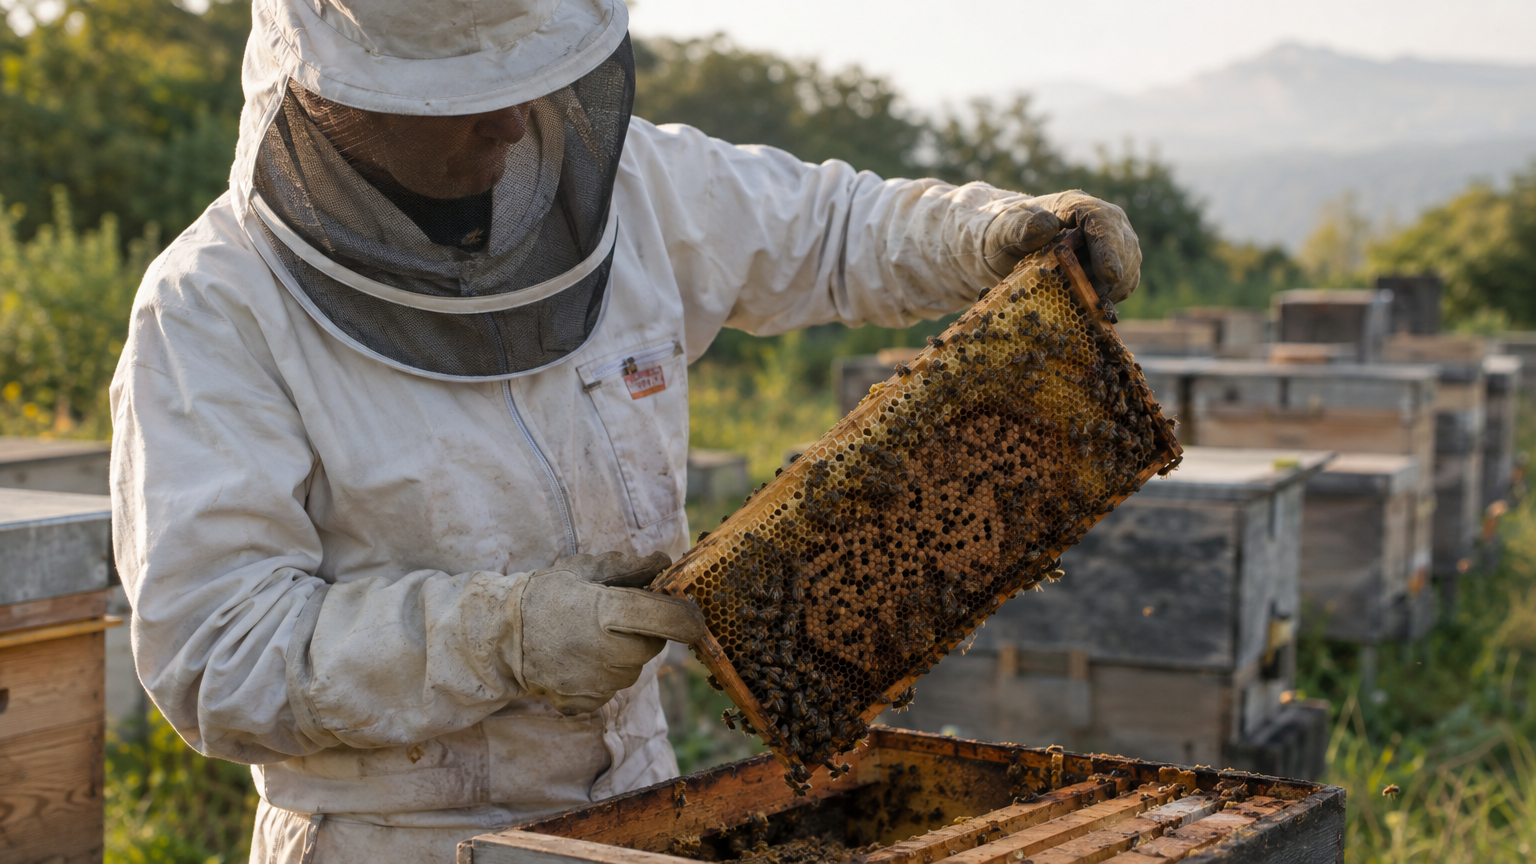 A frame inspection in progress: a single data point that only matters as part of a running record.
The State of American Beekeeping
American beekeeping has just come through its worst recorded year. According to the 2024–2025 U.S. Beekeeping Survey, conducted by Auburn University and the Apiary Inspectors of America, U.S. beekeepers lost an estimated 55.6% of managed honey bee colonies between April 2024 and April 2025.
That is the highest annual loss rate recorded since national tracking began in 2010–2011, and it sets a new ceiling for the national record.
Winter did the sharpest damage. The same survey found that winter losses alone reached 40.2% between October 2024 and April 2025, surpassing the previous record of 37.7% set in 2018–2019.
Losing two of every five managed hives between October and April is territory the national record had never entered before. Every lost colony must be replaced — by splitting surviving hives, buying packages, or catching early swarms — and each replacement costs money and gives up part of the season's build-up.
The beekeepers who absorb years like this best are the ones who see trouble building in time to act. That visibility comes from looking inside the hive on a schedule and writing down what they find.
of managed colonies lost, April 2024 – April 2025
Highest annual loss rate since tracking began in 2010–2011
40.2%
winter losses, October 2024 – April 2025
The worst winter for managed colonies on record
Why It Matters Beyond the Hive
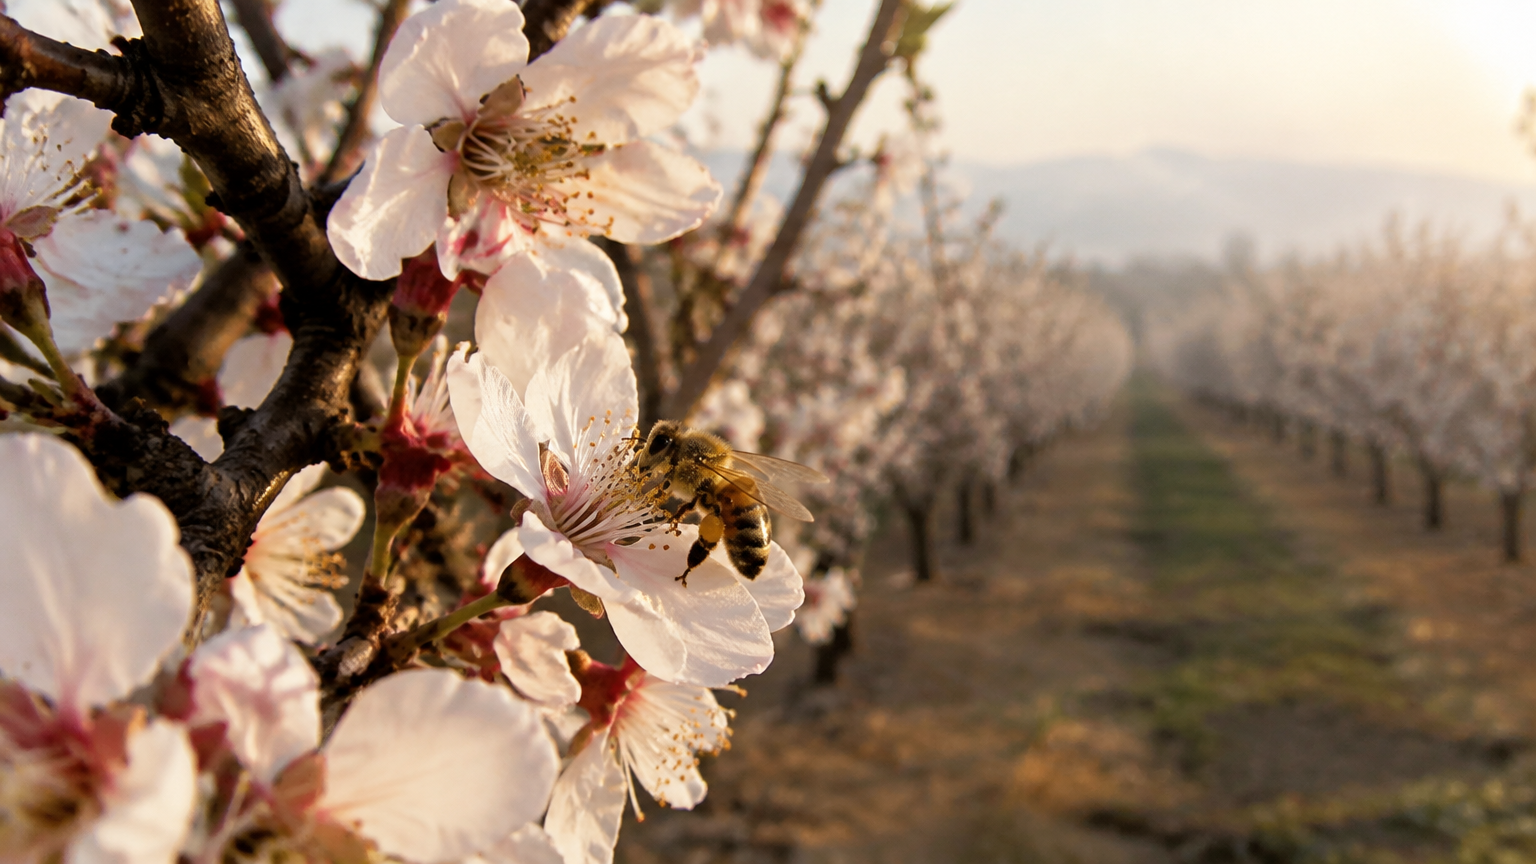 Pollination is the link between hive health and the food supply.
Colony losses do not stay inside the bee yard. According to a peer-reviewed study of Varroa mite patterns across Illinois apiaries, published via PMC/NCBI, honey bee pollination contributes at least $11 billion annually to U.S. agriculture — primarily through the pollination of the specialty crops that commercial hives are moved into bloom to service.
The same study frames the wider dependency. Insect and animal pollination is estimated to contribute at least $235 billion annually to the world economy, and roughly 87.5% of flowering plants depend on pollinators.
When a colony dies in a commercial apiary, the loss travels — to the grower who rented the hives, to the crop that sets less fruit, and ultimately to a food supply that leans heavily on managed pollination. That is the practical case for treating colony health as a data problem: the value at risk is measured in the billions, and it is protected — or lost — one hive inspection at a time.
Annual contribution of honey bee pollination to U.S. agriculture
Primarily through specialty crops
Annual contribution of insect and animal pollination to the world economy
An estimated minimum
Flowering plants that depend on pollinators
Roughly, per the same study
The Varroa Problem, By the Numbers
Varroa destructor is a parasitic mite that attaches to honey bees, reproduces inside capped brood cells, and carries viruses from bee to bee as it moves through the colony. Mite populations multiply steadily through the season, and an unmanaged colony commonly weakens and collapses late in the year.
No colony is truly mite-free, so the practical question is when a mite load crosses the line worth acting on. According to Penn State Extension, action thresholds are commonly set around 2 mites per 100 bees. Mississippi State University Extension places the action threshold in a 3–6% range of a 300-bee sample, depending on colony size, region, and season.
The exact trigger moves with the calendar and the strength of the colony. But both guides point to the same practice: the decision to treat should follow a measured count, not a guess.
mites per 100 bees
The commonly used varroa action threshold.
3–6%
of a 300-bee sample
The action threshold range, depending on colony size, region, and season.
That practice is precisely what the recent research bears out. The same peer-reviewed study of Varroa mite patterns across Illinois apiaries, published via PMC/NCBI, ran the comparison directly — and the result is the sharpest finding on this page.
“Monitoring and treating for varroa mites together protects colonies — but treating without first monitoring is no more effective than not treating at all.”
Key finding of a peer-reviewed study of Varroa mite patterns across Illinois apiaries, published via PMC/NCBI
How Often, and What to Look For
Ask a room of beekeepers how often a hive should be opened and you will get a range of answers, but beekeeping industry guidance from Dadant & Sons and PerfectBee points to a similar practical rhythm: inspect hives roughly every 7–10 days during the active spring-through-fall season, tapering to about once a month over winter.
Both guides note that new colonies and new beekeepers typically need more frequent checks than established ones. And it is worth being clear about what this advice is: practical guidance from industry publications, not a peer-reviewed finding — treat the range as a starting point to adapt to your climate, your colonies, and the season.
Every 7–10 days
About once a month
More important than the exact interval is what each visit actually records. A thorough inspection checks six things, in roughly the same order every time:
Colony strength
Approximately how many bees fill the boxes, and whether the population looks consistent from frame to frame.
Queen status
Whether the queen is spotted, or — often more practical — whether her signature is visible: fresh eggs and young brood in a tight, healthy pattern.
Brood pattern
How densely and evenly larvae and capped brood occupy the frame. Gaps, spotty laying, or sunken cappings are early warning signs worth recording.
Mite counts
A measured load from a consistent method — alcohol wash, sugar roll, or a sticky-board count — not a visual impression.
Disease signs
Anything abnormal: deformed wings, chalkbrood mummies, American foulbrood scales, unusual odor, or unusual bee behavior at the entrance.
Honey stores
An estimate of capped honey and available nectar, judged against the season and the coming weeks of weather.
Six fields, recorded the same way every time — that is the difference between an inspection and a data point.
From Single Inspections to a Real Program
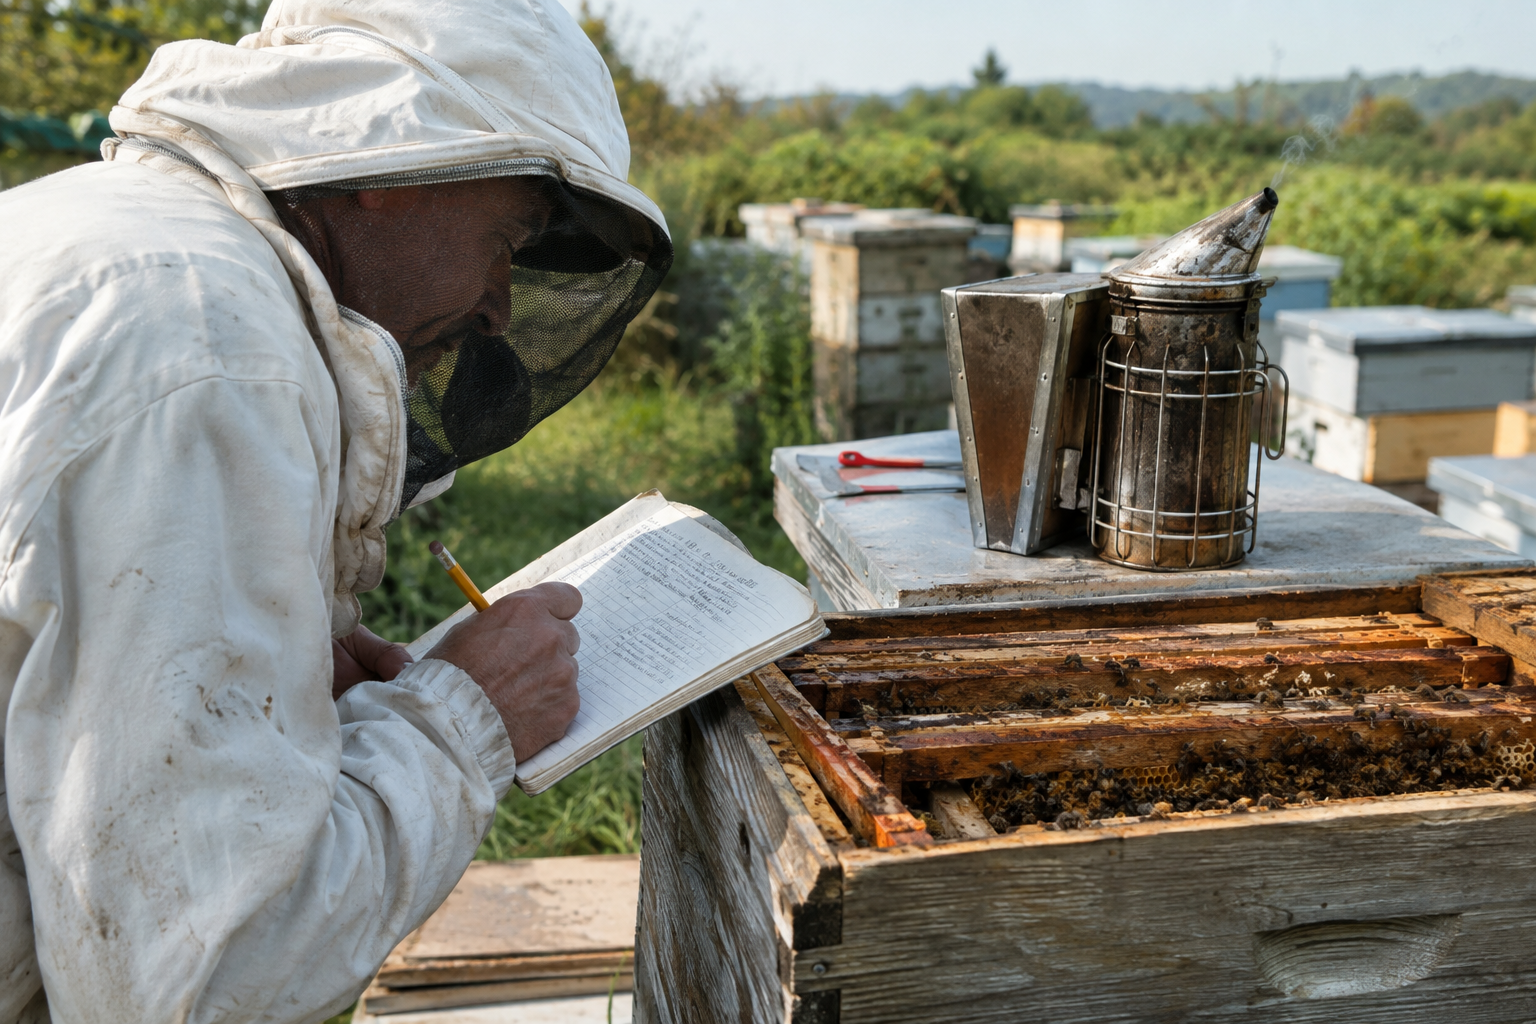 The moment an inspection becomes a data point: what was seen, written down where it can be compared.
One inspection is a snapshot. It tells you what a colony looked like today — but on its own, it cannot tell you whether the mite count is climbing, whether the brood pattern is holding, or whether last month's treatment actually worked.
The value emerges from comparison: mite counts across months, colony strength across a season, treatment history across years. That is what turns a folder of paper notes into an inspection program — and what separates noticing a problem from being able to see it coming.
Getting there requires structured, consistent records — the same fields, captured the same way, every time — not memory and not scattered notes. A beekeeper who can look back at a full season of comparable entries is working with evidence. A beekeeper working from recollection is working from an impression.
What a Data-Driven Inspection Program Requires
None of this requires special equipment. A data-driven program rests on four decisions, made once and then held to.
01
A consistent checklist
The same fields, recorded the same way, every visit: colony strength, queen status, brood pattern, mite counts, disease signs, stores. When the checklist drifts — different fields this month, a different scale next — records stop being comparable, and trends become unreadable.
02
A view across time, not just one visit
A single count tells you where a colony is; a series tells you where it is going. A program needs a way to see counts across months, strength across the season, and hives beside each other within a yard — because the outlier in an otherwise consistent row is the colony that needs the next visit first.
03
A schedule tied to season and colony age
The rhythm of the active season tapers toward winter, and new colonies warrant more frequent eyes than established ones. A data-driven program fixes that cadence in advance — planned per yard and per colony — instead of relying on whoever remembers, so the hives that need watching soonest are the ones that actually get watched.
04
Records the whole operation can see
When one person keeps the notebook, the program's knowledge disappears with them — on vacation, on sick days, when they change operations. Shared, visible records mean any beekeeper can pick up where the last visit left off, and the operation can see its season as a whole.
How aQRate Fits In
Everything above describes the program. This section describes a platform built to run it. aQRate is a field data collection and inspection-management platform made by Roshan Water Solutions, and it ships with a Beehive Inspections starter template — a ready-made workspace a new customer starts from in one click, built for detailed field inspection of beehives with insights delivered through customizable dashboards. The template arrives with 107 sample records already loaded, so the trends below can be explored before the first real visit is ever logged, and its capabilities line up one-to-one with the four principles.
Custom forms, built once, no code
The template's main form, Hive Visit-Repeated Form, is designed once — the same fields every time: Hive ID, Visit Type, Colony Strength, Frames Covered, Queen Present?, Queen Status, Queen Marked?, Brood Pattern, Brood Stages Observed, Colony Temperament, No. Honey Frames, and No. Pollen Frames. Field beekeepers don't design anything; they open the form and fill it in, which is exactly what keeps records comparable. A second form, Bee Hive Inspection, covers the same ground for operations that want a variant.
Dashboards and visualizations
Because every submission lands in the same structure, the template's Beehive Inspection Dashboard shows every visit in one view — colony strength and brood pattern by hive and by month, yards beside each other — the view that shows a trend climbing toward the action threshold while there is still time to treat.
Offline-first mobile capture
Apiaries sit where the signal doesn't. aQRate's native iOS and Android apps keep collecting data with no connection and sync automatically when one returns, and planned visits can be assigned and tracked as work orders — so the cadence survives contact with real field conditions instead of quietly slipping.
One portal for the whole team
Every inspection, photo, count, and treatment record lands in one web portal the whole operation can see — not in one person's notebook. Whoever opens a hive next starts from the last visit, not from scratch, and any visit can be compiled into a Hive Technical Inspection Audit PDF report for the operation's records.
The template's inspection form, built and filled
Watch the Hive Visit-Repeated Form take shape and capture a real visit — the same fields, in the same order, every time. Scroll the phone screen to walk the full checklist.
Hive Visit-Repeated Form
Hive ID*
Visit Type*
Colony Strength*
Frames Covered*
Queen Present?*
Queen Status*
Queen Marked?*
Brood Pattern*
Brood Stages Observed*
Colony Temperament*
No. Honey Frames*
No. Pollen Frames*
Hive Visit-Repeated Form
NYC-02
Routine Maintenance
Weak
3
Yes
Laying Well
Yes
Solid
Capped
Calm
5
1
Report ready: Hive Technical Inspection Audit
Frequently Asked Questions
Answers are drawn from the sources cited inline above and linked in the Sources section at the end of this page.
There is no single universal number, but the extension guidance lands in a consistent range. Penn State Extension notes that action thresholds are commonly set around 2 mites per 100 bees, while Mississippi State University Extension places the action threshold in a 3–6% range of a 300-bee sample, depending on colony size, region, and season. The common thread in both guides: the trigger is a measured count, and the number moves with the time of year and the colony in front of you.
Not according to the recent evidence. A peer-reviewed study of Varroa mite patterns across Illinois apiaries, published via PMC/NCBI, found that monitoring and treating for varroa mites together protects colonies — but that treating without first monitoring is no more effective than not treating at all. In practical terms, the count is not paperwork before the treatment; it is what makes the treatment work.
Beekeeping industry guidance from Dadant & Sons and PerfectBee suggests inspecting roughly every 7–10 days during the active spring-through-fall season, tapering to about once a month in winter, with new colonies and new beekeepers typically checked more often than established ones. Treat this as practical starting guidance rather than peer-reviewed consensus, and adapt the rhythm to your climate, your colonies, and the season.
Because an inspection on its own is a snapshot: it tells you what is true in one hive today, and nothing about direction. The protective value comes from comparison — mite counts across months, colony strength across a season, treatment history across years — and comparison only works if the records are structured and consistent. The research agrees at the level of method: the peer-reviewed study of Varroa mite patterns across Illinois apiaries, published via PMC/NCBI, found that monitoring combined with treatment is what protects colonies, which makes the record of counts part of the treatment itself, not extra work after it.
Sources
Every statistic in this article is attributed inline to the source it comes from. The sources cited on this page are listed below, in the same words used inline.
Cited for: The estimated 55.6% loss of managed honey bee colonies between April 2024 and April 2025, the winter loss of 40.2% between October 2024 and April 2025, and the previous winter-loss record of 37.7% set in 2018–2019.
2. A peer-reviewed study of Varroa mite patterns across Illinois apiaries, published via PMC/NCBI
Cited for: Honey bee pollination's contribution of at least $11 billion annually to U.S. agriculture, the estimated $235 billion annual contribution of insect and animal pollination to the world economy, the roughly 87.5% share of flowering plants that depend on pollinators, and the finding that monitoring and treating for varroa mites together protects colonies while treating without first monitoring is no more effective than not treating at all.
Cited for: The commonly used varroa action threshold of around 2 mites per 100 bees.
4. Mississippi State University Extension
Cited for: The varroa action threshold range of 3–6% of a 300-bee sample, depending on colony size, region, and season.
5. Beekeeping industry guidance from Dadant & Sons and PerfectBee
Cited for: The practical inspection cadence of roughly every 7–10 days during the active spring-through-fall season, tapering to about once a month in winter, and the guidance that new colonies and new beekeepers typically need more frequent checks than established ones.